Run the Models and View Results
After WEAP does it calculations for each scenario, including running
MODFLOW at each timestep, WEAP combines all the individual MODFLOW input
files for a scenario (one set for each WEAP time step--each set represents
one MODFLOW stress period) into one set of files that covers all WEAP
time steps (the set has as many MODFLOW stress periods as there are WEAP
time steps in the entire simulation). WEAP
runs this large MODFLOW model, and then runs MODPATH, using the currently
loaded MODPATH Options Set. Just
as it does when running MODFLOW, WEAP creates
temporary MODPATH files for each scenario it calculates. (Because
a complete set of new input files are created and kept for each scenario,
you will be able to run them yourself in MODPATH outside of WEAP, if you
want to examine the results in more detail, or to make slight changes
to the inputs. Note that any changes you make directly to these temporary
input files will be lost the next time WEAP does its calculations, so
you are advised to save them in another directory if you want to preserve
them. The temporary filenames all start with "!MP!" to distinguish
them from other files.) MODPATH
can only calculate particles in active cells. If
a cell goes dry, any particles in that cell will not exist. Check
the MODFLOW report on dry cells to determine if this is happening.
In the Results View, choose Supply and Resources \ Groundwater \ MODFLOW
\ Particle Pathline. On the Chart tab, WEAP displays particle pathlines
as 3-dimensional vectors. Each
particle will display as a line showing its path over time in three dimensions.
Using the mouse, click and drag on the chart to rotate it, or move the
sliders below to manipulate it. Shift-click and drag to pan the chart,
or use the mouse wheel to zoom in or out. Click
the "Rotate" button to start it spinning. Position
the mouse on or near a point on a 3-D pathline to see a description of
it in the status bar at the bottom of the WEAP window. Click
the "Top," "Front" or "Left" buttons to
switch to a 2-D view showing a cross-section as seen from the chosen face
(top, front or left).
The lines are plotted in one of two coordinate spaces, depending on
the setting of the "Show X,Y" checkbox at the top. If
"Show X,Y" is checked, the coordinates are X,Y,Z, all in length
units (e.g., feet or meters) selected at the top. X
is the distance from the left face of column 1, Y is the distance from
the front face of the last row, and Z is the elevation. These
are based on column and row widths, and cell elevations, from the MODFLOW
Discretization file. If
"Show X,Y" is not checked, the coordinates are Column, Row,
Elevation, where Column and Row are fractional positions within a cell
(e.g., Row=5.5 is the middle of row 5), and Elevation is in length units
selected at the top. Go
to the Table tab to see the 3-D coordinates for each particle and time
step. The
coordinates are shown either as (Row, Column, Z) or (X, Y, Z). You
can turn off the "Y=0" button to the right of this chart to
magnify the changes in elevation over time.
Each particle is listed in the legend (using the format chosen for the
current MODPATH Options Set). For
example, it might include the Layer, Row, Column coordinates where it
was released: "Particle 1: (1, 10, 22)". Note:
If there are multiple particles per cell or multiple releases times, there
will be particles with the same starting coordinates in their names.
The 3-D pathlines are made up of connected 3-D line segments, each of
which connects the position of a particle on two successive time steps.
Each point
shown corresponds to the position of the particle at the end of that timestep.
You may
select to see all months and years and all particles, or select subsets
of them. Tip:
You can speed up the display by selecting just one month from each year
to display. For
example, select December only and each line segment will show the jump
in the position from the end of December in one year to the end of December
in the next year. (See
chart below for an example of this.) Click
the Arrowhead icon on the right tool bar to show or hide arrowheads on
each line segment.
You can change the MODPATH options or starting particles positions without
leaving the Results View--click the "Particle Generation and MODPATH
Options" dropdown button on the upper right to quickly switch from
one options set to another. When
you change it, MODPATH will automatically recalculate using the new particles
and MODPATH options. You
can also edit or add Options Sets--click the "Edit" button to
the right of the dropdown box to go to the Edit
Particle Generation and MODPATH Options screen. When
you exit that screen, MODPATH will automatically recalculate if you had
made any changes. Because
the normal WEAP or MODFLOW calculations do not need to be re-run when
the MODPATH options have changed, this process is very quick.
The color of each line segment represents one of several different types
of information, selected by the "Color by" dropdown box just
above the legend (in the example below, it is set to "Color by Particle").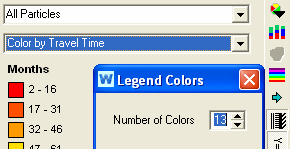 In
two cases, the entire pathline for a particle will have a single color
(Color by Pathline, Color by Release Time); in the other cases, each line
segment of each particle pathline can have a different color, representing
information about the particle either during the time it moved from the
beginning of the line segment to the end of the line segment (Color by
Velocity) or at the moment when it was at the end of the line segment
(Color by Travel Time, Color by Absolute Time, Color by Travel Distance,
Color by Elevation, Color by Layer, Color by Layer (fractional)).
Color by Particle: Each particle pathline has
a different color.
Color by Travel Time: Each line segment has a
color corresponding to the number of timesteps the particle has traveled
since its release to the position of the end of the line segment, e.g.,
6 months.
Color by Absolute Time: Each line segment has
a color corresponding to the date when the particle had reached the position
of the end of the line segment, e.g., December 2015.
Color by Release Time: Each particle pathline
has a color corresponding to its release time, e.g., January 2008.
Color by Travel Distance: Each line segment has
a color corresponding to the cumulative distance the particle has traveled
from its release point to the position of the end of the line segment,
e.g., 10 meters. The
length unit can be changed in the unit dropdown box to the right of the
chart title.
Color by Velocity: Each line segment has a color
corresponding to the velocity of the particle during its travel from the
beginning of the line segment to the end of the line segment, e.g., 108
meters/year. The
length unit can be changed in the unit dropdown box to the right of the
chart title.
Color by Elevation: Each line segment has a color
corresponding to the elevation of the particle when the particle had reached
the position of the end of the line segment, e.g., 200 meters. The
length unit can be changed in the unit dropdown box to the right of the
chart title.
Color by Layer: Each line segment has a color
corresponding to the MODFLOW model layer of the particle when the particle
had reached the position of the end of the line segment.
Color by Layer (fractional): Each line segment
has a color corresponding to the MODFLOW model layer of the particle when
the particle had reached the position of the end of the line segment.
The layer
is given as a decimal number, indicating the distance between the layer's
top and bottom, e.g., layer 1.5 means that the particle is halfway between
the top and bottom of layer 1.
For "Color by Particle," you can change the color scheme and
whether or not to use patterns for the lines; the other choices all use
the rainbow palette, without patterns. For
choices other than "Color by Particle," you can set how many
different colors to use--click the rainbow button on the toolbar on the
right (see above).
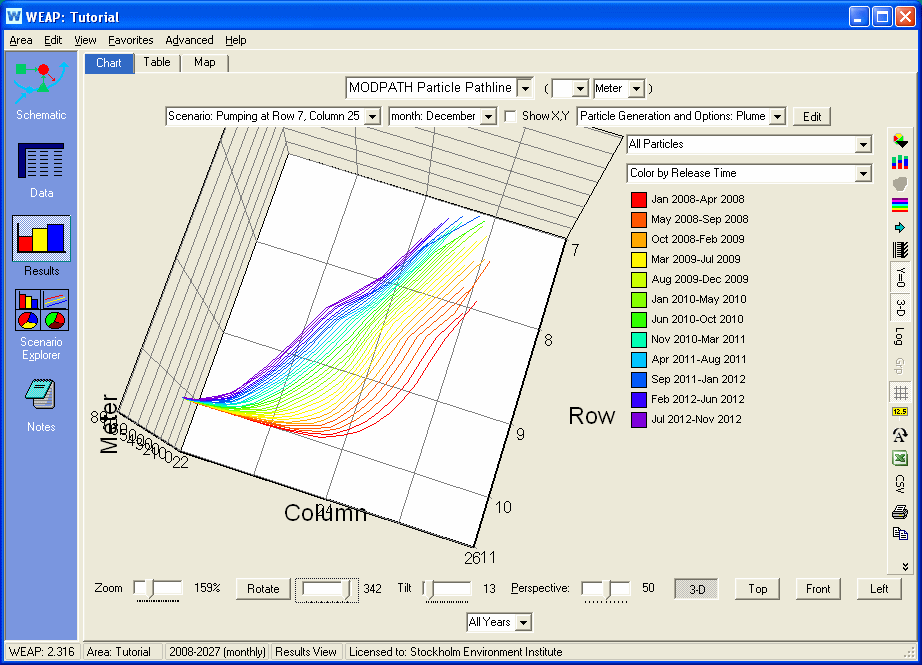
Here is an example showing the plume that results from releasing particles
at the same location over successive time steps, using a forward tracking
analysis. In
this scenario, pumping rates increase over time, which causes the particles
released later (shown in blue and purple) to move more quickly towards
the well (at row 7, column 25).
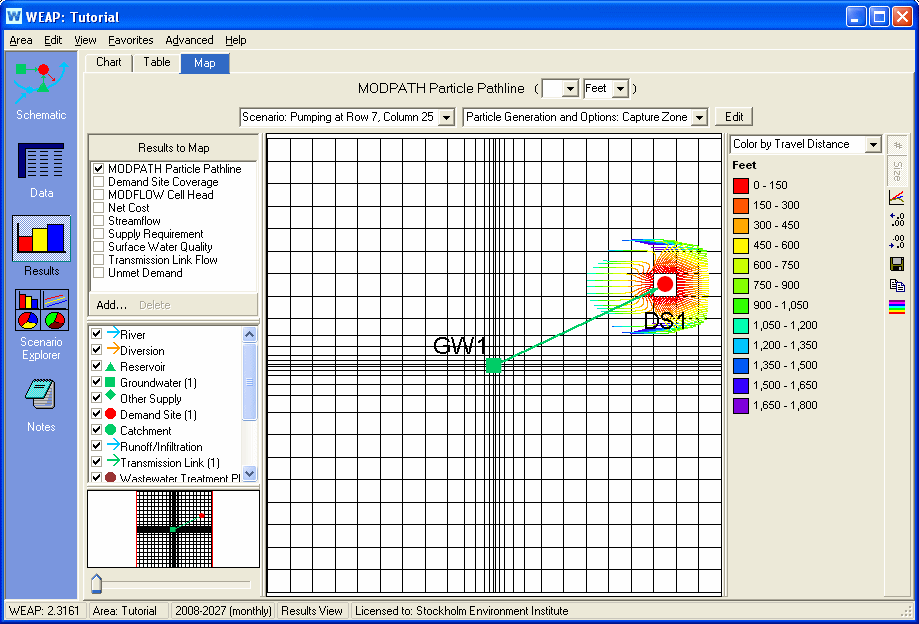
On the Map tab, WEAP overlays 2-dimensional particle pathlines on top
of the Schematic. Here
is an example showing the capture zone for a well, using a backward tracking
analysis of particles arranged on faces 1, 2, 3 and 4 of the well cell
(at row 7, column 25), all released at the end of the simulation (December
2027) and traced backwards in time. By
choosing Color by Travel Time, the colors show how long it takes each
particle to reach the well.
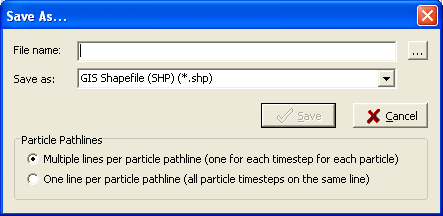
From the Map tab, the pathlines can be saved as a GIS Shapefile. Click
the  button on the toolbar to the right and choose save as "GIS Shapefile
(SHP)". You
can choose to create a separate line in the shapefile for each particle
pathline line segment (there is a line segment for each timestep for each
particle), or group together all the line segments for each particle into
one line. When saving lines segments separately, WEAP will include information
in the shapefile's attribute table for each particle timestep, such as
distance traveled and velocity. This
information will be useful if you later want to display the shapefile
in a GIS program, such as ArcGIS, and color code the line segments by
these attributes.
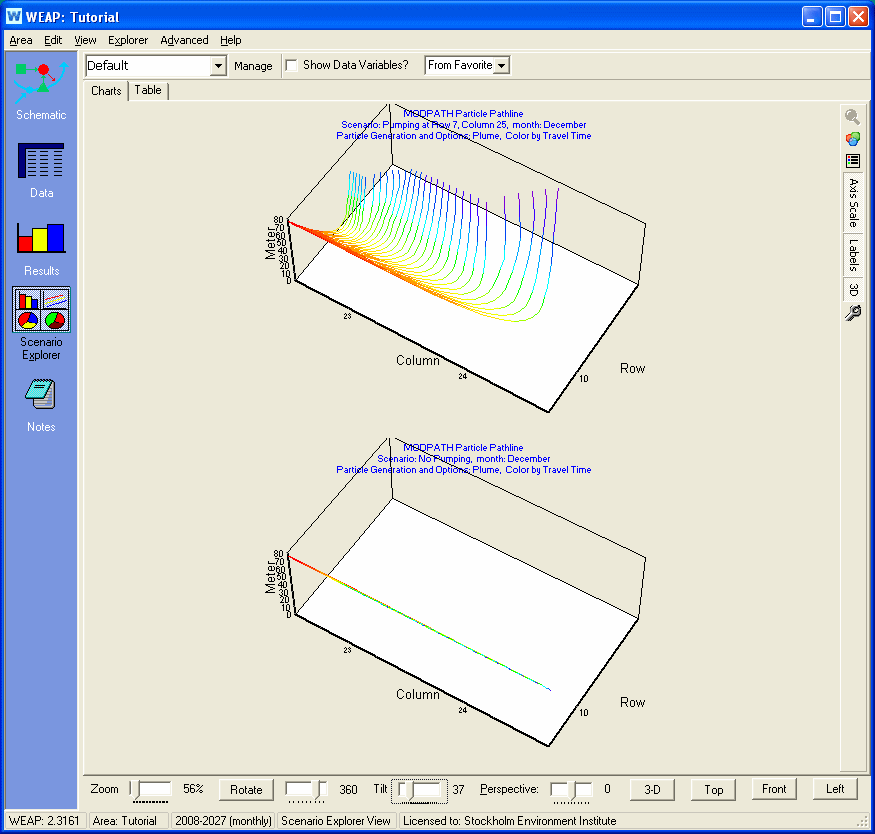
The Scenario Explorer View can display
multiple pathline results (saved as Favorites) for different Particle
Generation and MODPATH Options, or for different scenarios. In
this example, favorites have been saved for the same variable but for
different scenarios, showing how the particle plume is strongly affected
by pumping (one scenario has pumping; the other scenario does not). Choose
"From Favorite" to see both scenarios. Click
the "Axis Scale" button on the right to use the same scales
for the axes so that the different charts can be easily compared.
 In
two cases, the entire pathline for a particle will have a single color
(Color by Pathline, Color by Release Time); in the other cases, each line
segment of each particle pathline can have a different color, representing
information about the particle either during the time it moved from the
beginning of the line segment to the end of the line segment (Color by
Velocity) or at the moment when it was at the end of the line segment
(Color by Travel Time, Color by Absolute Time, Color by Travel Distance,
Color by Elevation, Color by Layer, Color by Layer (fractional)).


