Results are shown on the map both as numeric labels and by varying the thickness of lines or size of nodes, or by coloring of shapes (polygons) to create "thematic" maps (see below). On the toolbar to the right of the map, click on the # symbol to turn on or off the numeric labels; click on "Size" to turn on or off the display of results as varying thickness of lines or size of nodes. You may increase or decrease the precision for the numeric labels using the buttons on the toolbar on the right. Another button will copy the map with results to the Windows clipboard.
Tip: Results displayed for links (transmission links, return flow links and runoff/infiltration links) may not always be placed for easy reading. However, you can reposition where the results appear: on the Schematic View, right click on each link and choose "Move Label." A sample number ("000") will appear -- move the mouse to the place you would like the result value to appear, then click the left mouse button to save the position. When you next view results on the map, they will use this new position. Unfortunately, you cannot reposition where river reach results appear.
A map displays results for just one snapshot in time. To get a better sense for how the results vary over time, you can display the corresponding chart below the map. To show or hide the chart, click on the chart icon, just below the "Size" button on the toolbar. The current time slice mapped will be marked with a black vertical line on the chart. Click anywhere on the chart to see that particular time mapped above. In addition, there is a "slider bar" below the map which ranges from the first timestep to the last timestep (these will be years, if "Annual Total" is checked). Click and drag the slider to quickly change from one time period to another. You can also click and drag on the chart to animate the map over time, or click and hold down the arrows to the left or right of the slider. The toolbar to the right of the chart gives the standard options to customize the appearance of the chart. Double click on the chart to zoom into it; this will switch to the Chart tab, with this chart loaded. The splitter bar between the map and chart can be repositioned to enlarge one and shrink the other.
To choose which result to map, check the appropriate box to the left of the map, under the heading "Results to Map." Nearly every result available on the Chart and Table tabs is available to map. If you do not see a result listed, click the "Add" button below the checkboxes to choose a new result for the list. Clicking the Delete button only removes the variable from this list -- you can always click Add later to add it back.
You can display more than one result at a time, as long as they have the same units. For example, check off Supply Requirement, Transmission Link Flow, and Return Link Flow to see the flow of water to and from demand sites, as well as their requirements. When mapping multiple results, only one can be charted at once. The chart title is a dropdown box from which you may select the variable (of those that are mapped) to chart.
The combination of the map and the chart is a powerful way to visualize your results. The chart shows you the full expanse of time, in which the maximum and minimums are revealed. Click on an interesting point on the graph below (such as a low streamflow or high unmet demand) to instantly see the state of the system (on the map above) at that time period. You can export these results to Google Earth -- see Export to Google Earth for details.
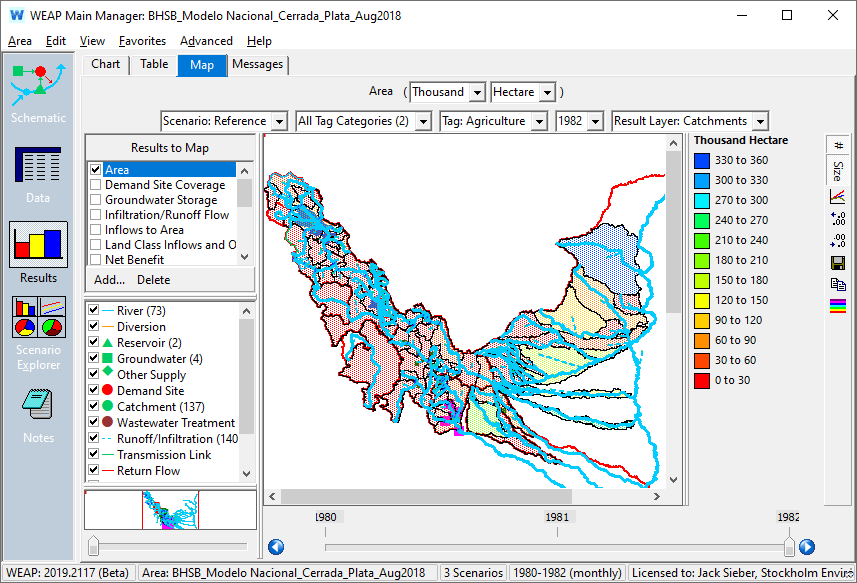
WEAP can display results by using “thematic” maps, where shapes on the map are colored based on the value of the result associated with the shape. For example, using the catchments layer that WEAP’s automatic catchment delineation creates, one can see how land use, irrigation, evapotranspiration or yields vary by catchment. The user can use any shapefile as the basis for visualization.
To display a thematic map, you must choose a Result Layer other than "WEAP Nodes and Arcs." (WEAP Nodes and Arcs is used to display results by varying the thickness of lines or the size of nodes.) Choose the Result Layer in a drop-down menu above the map on the right side. Any polygon shapefile you have added as a background layer on the Schematic can be used, although before using it the shapes in it must be linked to your schematic objects or demand branches -- see Linking Schematic Nodes to Layer Shapes below. Note: If you have used WEAP’s automatic catchment delineation to create rivers and catchments, WEAP creates a background layer named "Catchments" and links the shapes in it to the newly created catchments, so there is nothing else you need to do in order to use that layer for thematic maps.
Here is an example that shows the varying amounts of agricultural area by catchment in a region of Bolivia:
On the Schematic View, add or edit a background layer (it must be a vector polygon layer, not point or line or raster). Select the Linkage tab, and check the box for "Link Layer to Schematic Objects and Demand Branches?"
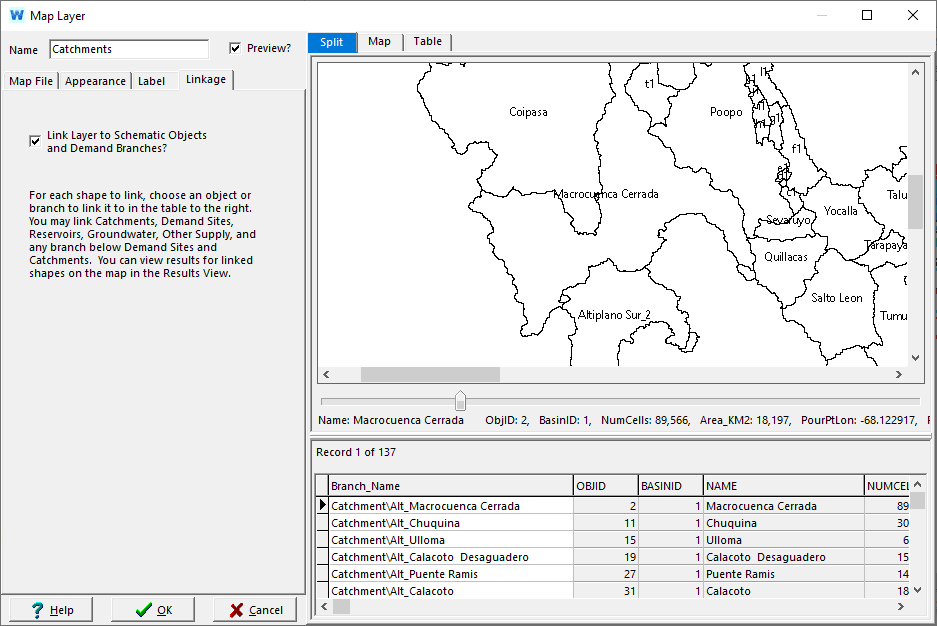
Each shape in the shapefile can be linked to objects on the Schematic (e.g., Catchments, Demand Sites, Reservoirs, Groundwater Nodes, but not Rivers or Links) or to demand branches. Each shape is represented by one row in the table. Use the drop-down menu in the "Branch_Name" column of the table to link the shape to an object or branch. When you click on a row, the corresponding shape will briefly flash in the map above to aid you in identification. You may link multiple shapes to the same object or branch. In the example above, the Catchments layer has 137 polygon shapes, each of which is linked to one of the of the 137 catchments on the Schematic. (This layer was created and linked by WEAP's automatically catchment delineation process.)
There is no limit to the number of different background layers that can be linked in this way. For example, you might have one layer for catchments, another for groundwater nodes, and another for cities (demand sites).