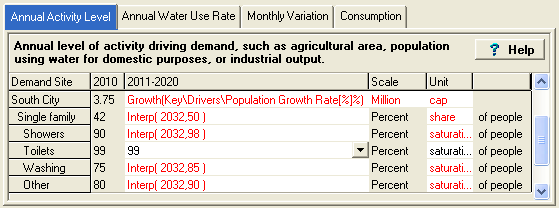
The annual demand represents the amount of water required by each demand. Losses, reuse, and efficiency are accounted for separately. Water consumption is calculated by multiplying the overall level of activity by a water use rate. Activity Levels are used in WEAP's Demand analysis as a measure of social and economic activity.

Activity levels for one of the hierarchical levels are typically described in absolute terms (in this case, the number of people in South City is 3.75 million in the Current Accounts), while the other levels are described in proportionate (i.e., percentage share or percentage saturation) terms. In the example shown above, 42% of the population lives in single-family households in 2010 and of these, 90% have showers. Notice that at the top level, the user chooses an absolute unit for the activity level (person). At lower levels, WEAP keeps track of the units, and hence knows that the percentage number entered at the second level is the share "of people". In general, WEAP lets you choose the numerator units for activity levels, while automatically displaying the denominator unit. When selecting an activity level unit, you can choose from any of the standard units. WEAP multiplies activity levels down each chain of branches to get a total activity. (See Calculation Algorithms for details.) For example, the total number of single-family dwellers in South City with showers in 2010 = 3.75 million people * 42% * 90% = 1.42 million people. Multiply this value by the water use rate per person per shower per year to get the total annual demand for South City single-family showers.
All values can be altered for future years in scenarios. This allows the planner to capture the combined effects of separate changes at many levels, such as, for example, the growth in the total population (shown above at the rate set in the Key Assumption variable "Population Growth Rate"), the change in household structure, the growing penetration of washing machines (from 75% to 85%), and the market share of less efficient vs. more efficient washing machines. To project these data, you first use the Manage Scenarios option to create one or more scenarios. Then, in the Data View, you override the default (constant) expressions entered in Current Accounts for each branch, with new expressions that describe how each value changes over time. See Expressions for more information.
Entered on: Data View, Branch: Demand Sites, Category: Water Use, Tab: Annual Activity Level