


WEAP
Water Evaluation and Adaptation Planning
WEAP is a user-friendly software tool that takes an integrated approach to water resources planning
WEAP In Action
Explore real-world projects powered by WEAP

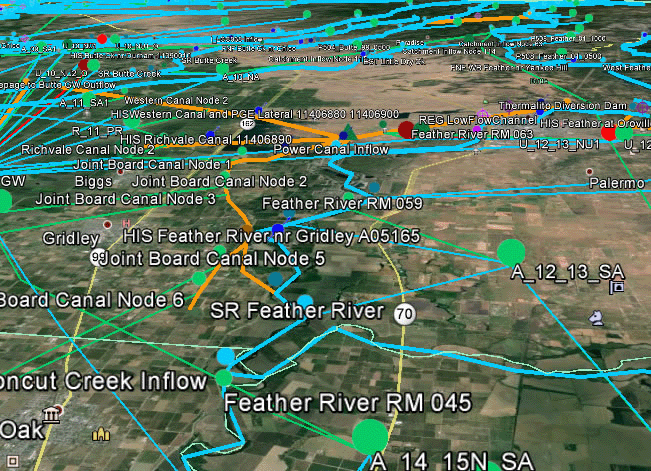
Balancing Water Use in California's Central Valley
SEI worked with the California State Water Resources Control Board and Stantec to develop SacWAM, a WEAP model that represents the Sacramento River Basin and Sacramento-San Joaquin Delta. SacWAM is helping decision-makers assess potential regulatory revisions, weighing trade-offs between protecting ecosystems, securing urban supplies, and sustaining agriculture.
Read More
Advancing Integrated Watershed Planning in Chile
In 2019, Chile's General Water Directorate (DGA) launched a national effort to prepare Strategic Water Plans (PEGHs) in all river basins, requiring integrated modeling of both surface and groundwater to address drought and other climate extremes. As of 2022, 39 PEGHs are informed with WEAP models, 29 of which are linked with MODFLOW in a unified modeling framework, including the five pilot basins—Copiapó, Limarí, Choapa, Petorca, and Ligua—from the initial study.
Read More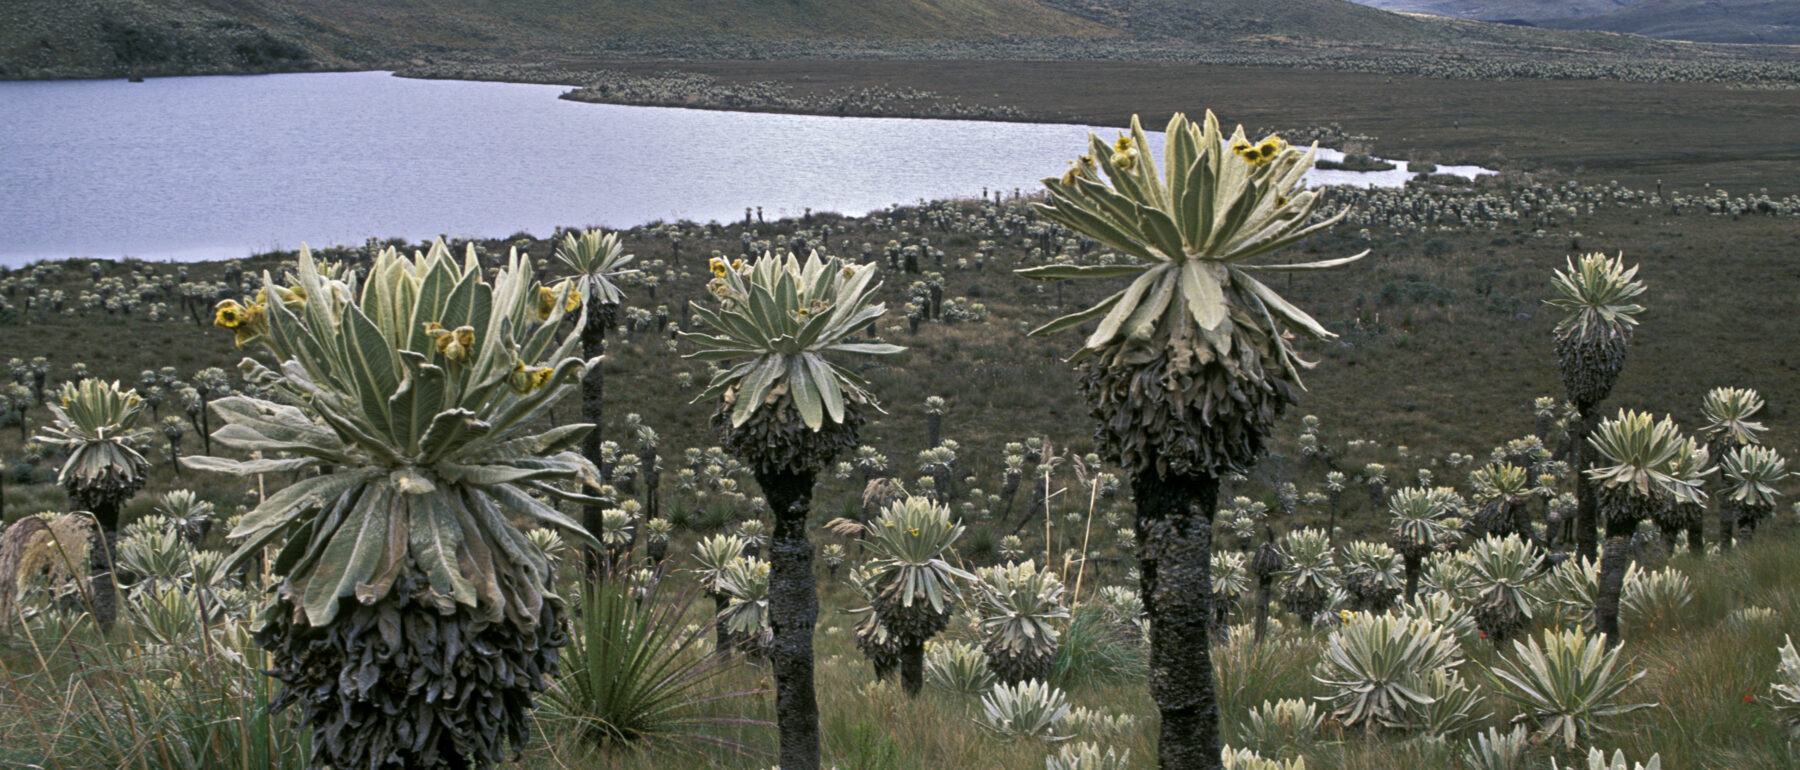
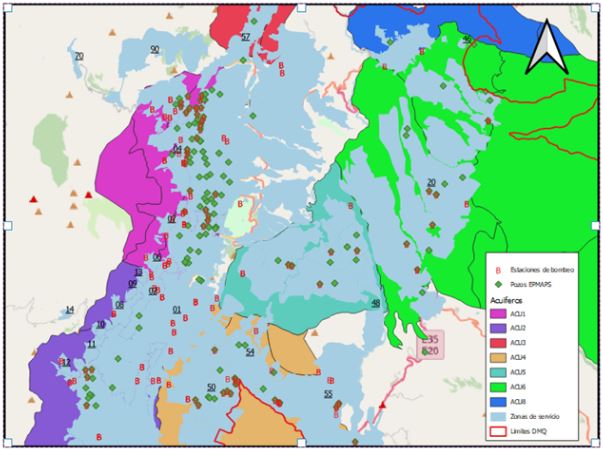
Building Urban Water Resilience in Quito
Through the DAR AGUA Quito project, SEI supported the EPMAPS water utility in strengthening its Master Water Plan under future uncertainty. A daily WEAP model simulated hydrology, seismic hazards (volcanic eruptions and earthquakes), and climate impacts. Adaptation management options, such as reducing water losses, expanding infrastructure, and conserving páramo wetlands, were visualized in a Tableau dashboard, enabling decision-makers to test strategies for a resilient water supply.
Read More
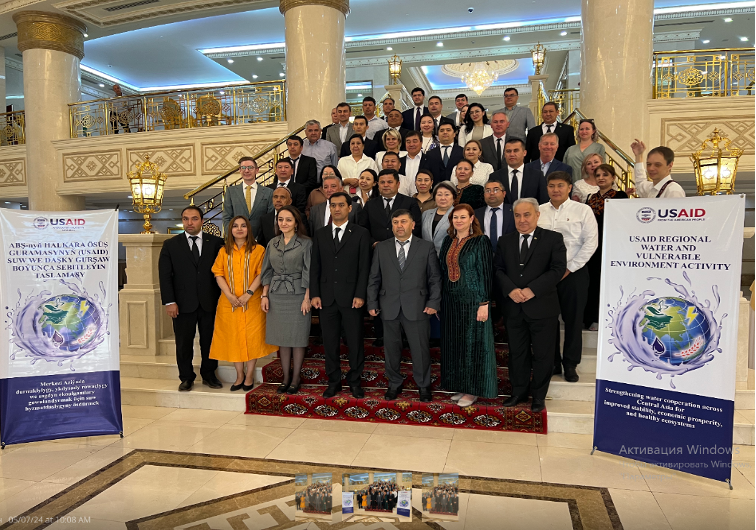
Linking Water and Energy in Central Asia
Since 2020, SEI has partnered with USAID and the World Bank to connect water, energy, and economic planning in Central Asia. By integrating WEAP with the LEAP energy model and AMES economic model, governments are able to explore co-benefits and trade-offs of mitigation and adaptation actions. Early findings revealed that billions of dollars in investments could be misallocated without this cross-sector perspective, including missing out on an additional 20% of storage in dry years.
Read More
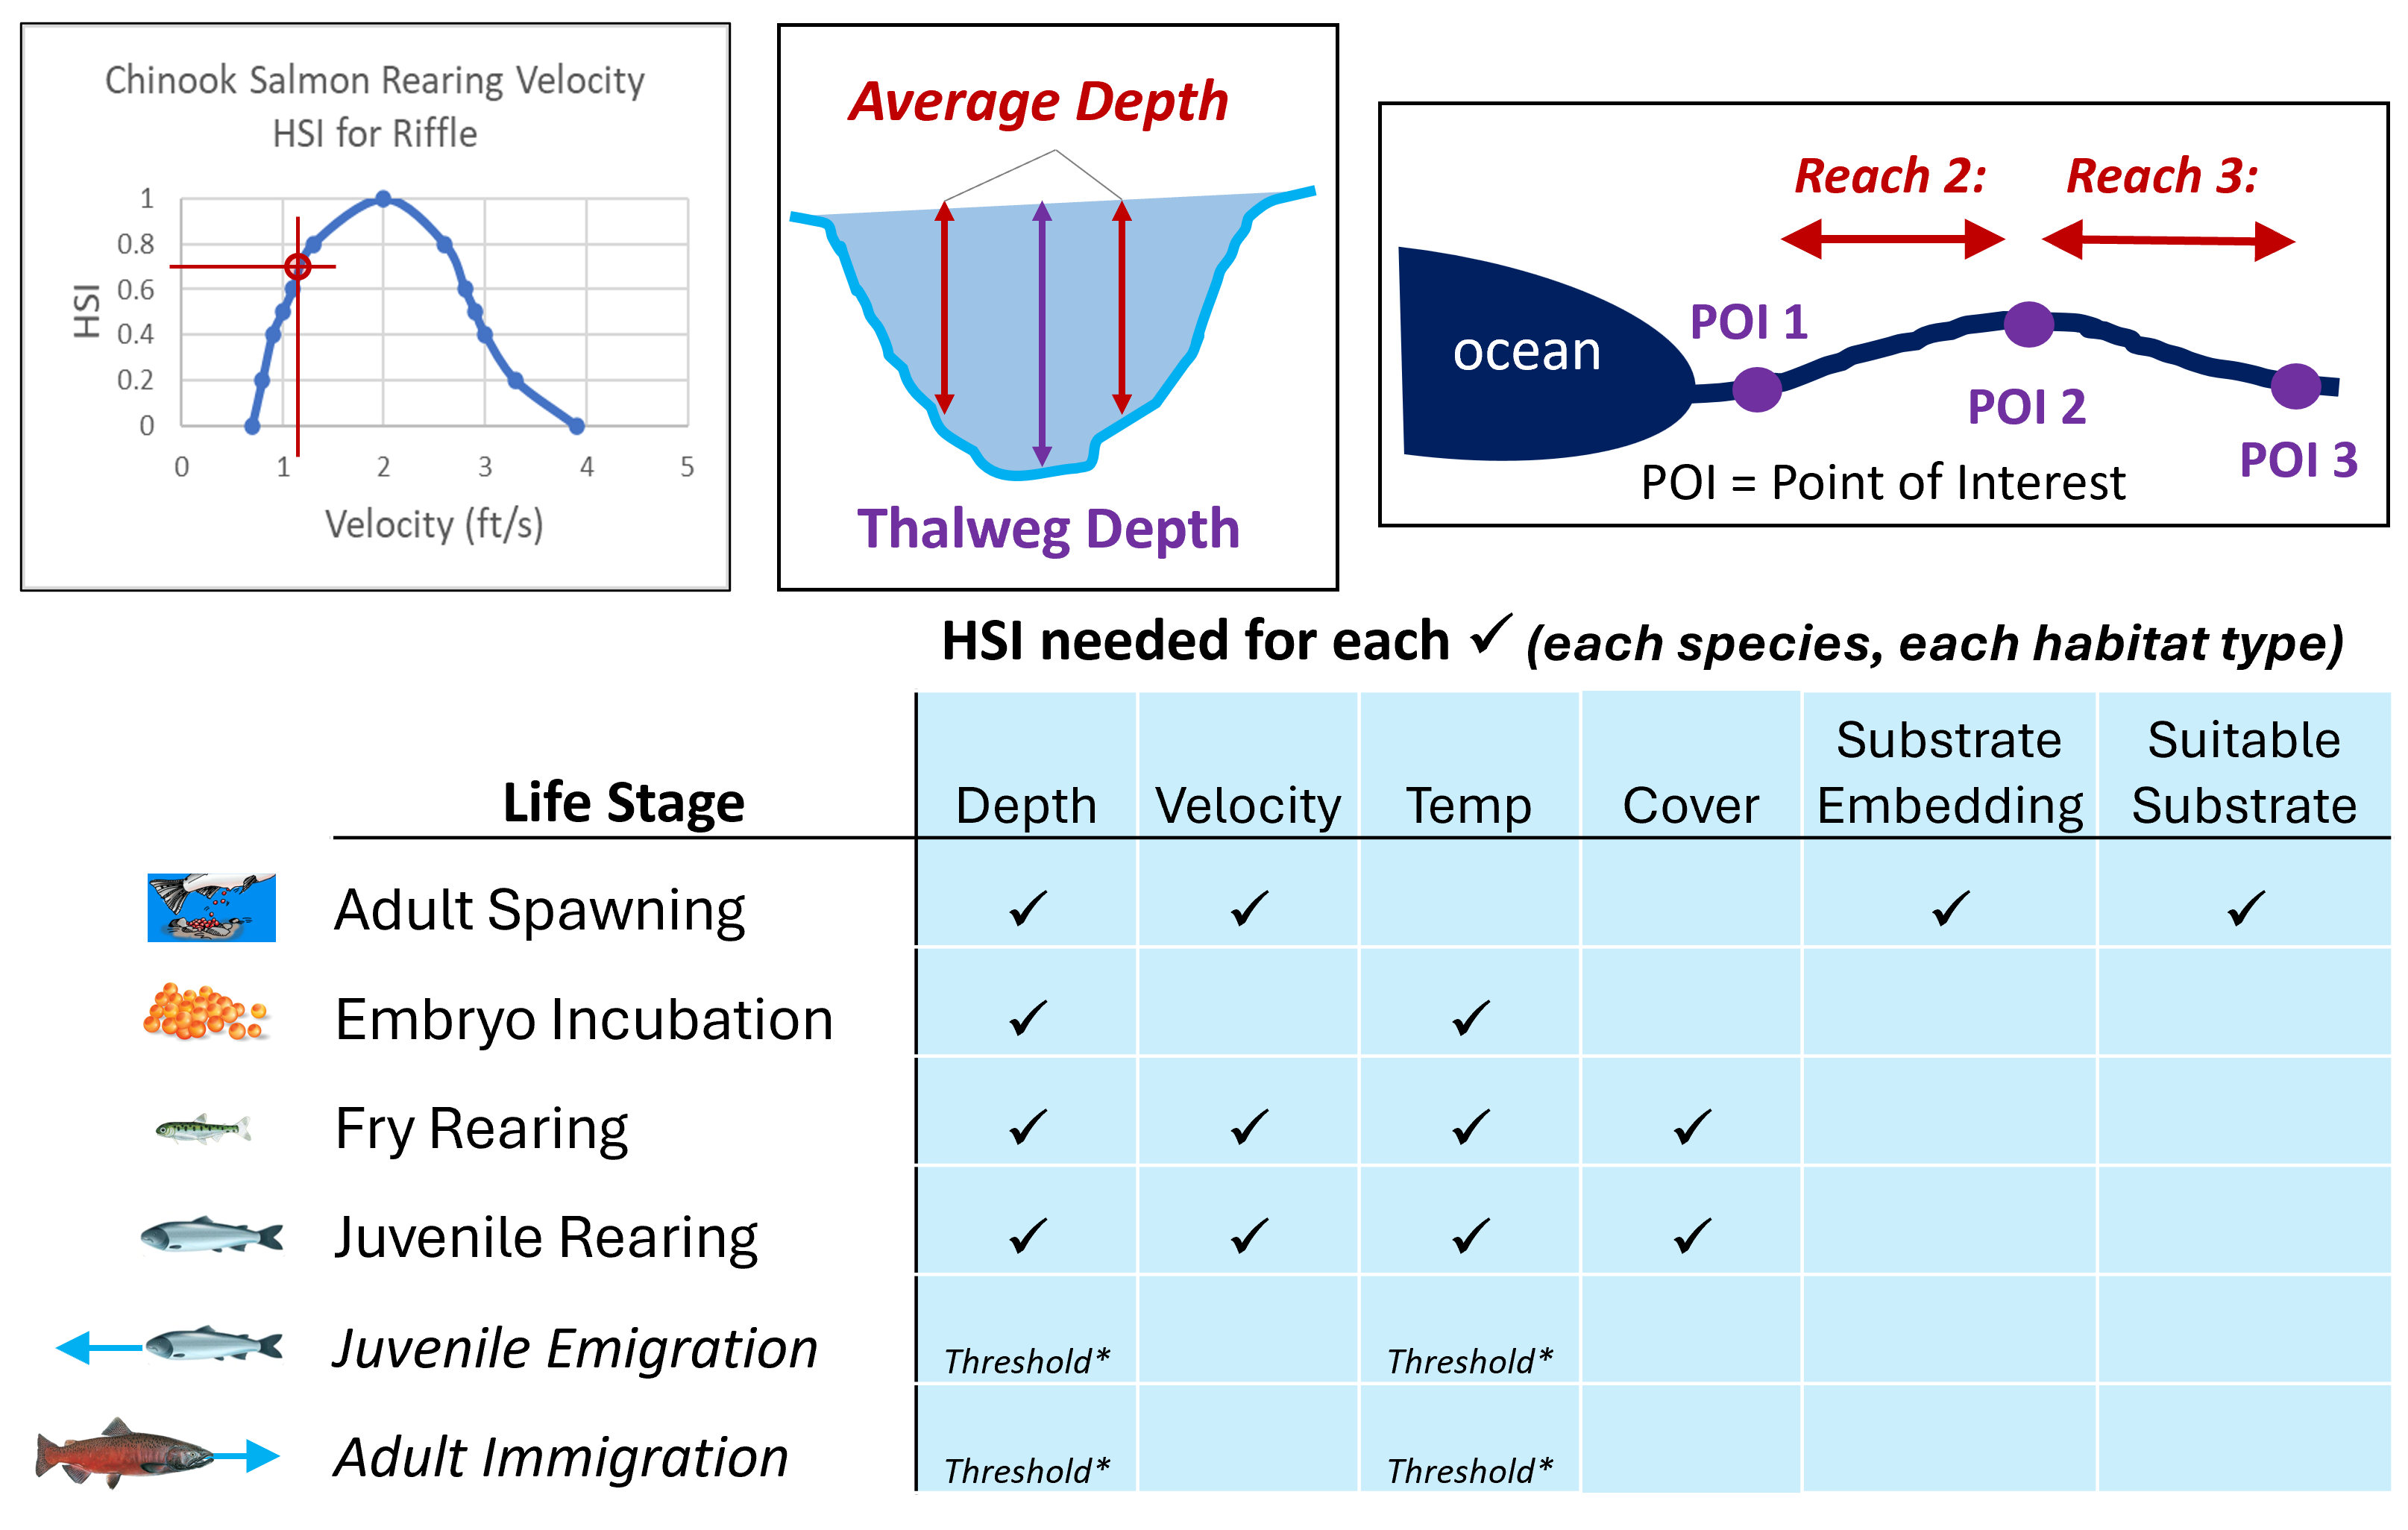
Reconciling Aquatic Habitat and Supply in California's Santa Clara Valley
SEI applied WEAP and the Aquatic Habitat Assessment (AHA) plugin to quantify tradeoffs of salmon and steelhead habitat alongside water supply reliability. The results were used by a range of conflicting parties to design and build consensus around the set of reservoir reoperations, which were certified under the final environmental impact report in 2023. The AHA plugin quantifies the surface area and suitability of habitat for the different life stages based on river conditions.
Read More
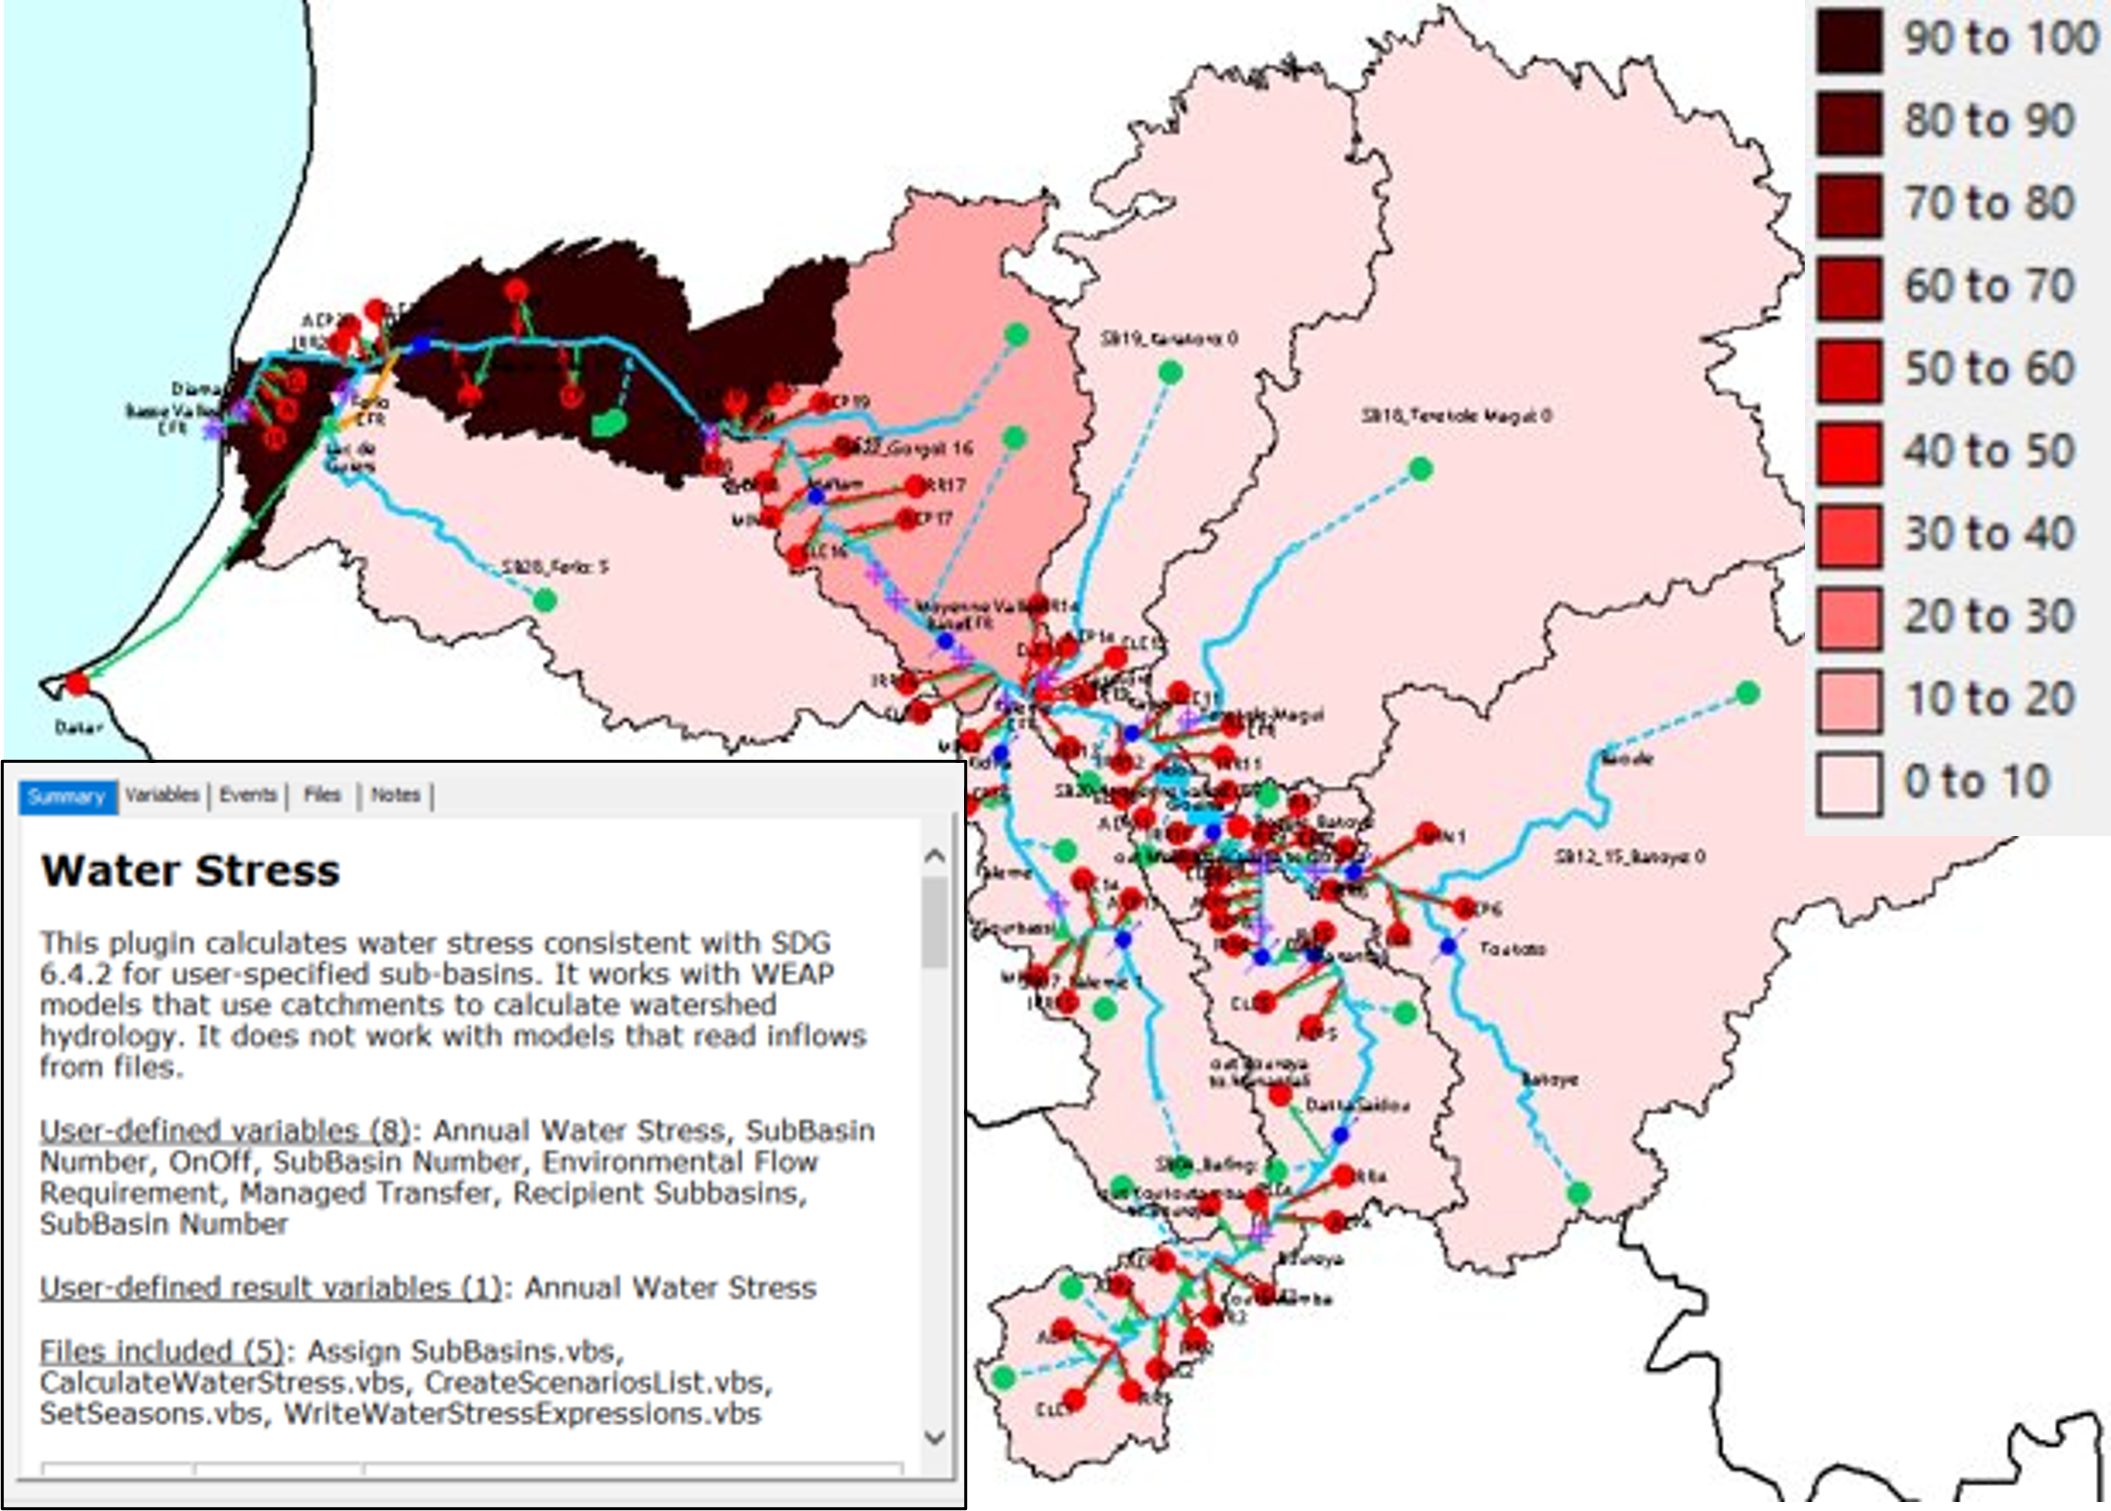
Measuring Water Stress with WEAP (SDG 6.4.2)
A new WEAP plugin developed with the UN Food and Agriculture Organization (FAO) calculates water stress at the catchment scale, supporting monitoring of Sustainable Development Goal (SDG) Indicator 6.4.2. This tool provides countries with detailed insights on water scarcity, helping them evaluate risks, prioritize adaptation actions, and track progress toward securing clean water and sanitation for all under a changing climate.
Read More

Supporting California Water Plan Update
The California Water Plan provides a framework for water managers, legislators, and the public to consider options and make decisions regarding California's water future. The Plan presents information on California’s water resources including water supply evaluations and assessments of various water uses to quantify gaps between water supplies and uses. The Plan identifies and evaluates existing and proposed statewide demand management and water supply augmentation programs and projects to address the State’s water needs. SEI has worked with DWR to develop an integrated, climate-driven water resources planning tool that was central to the Plan for conducting integrated scenarios analysis, wherein various management strategies were assessed within the context of a range of uncertainty relating to future trends in water demand and climate.
Read MoreThe most important gain is I think the improvement of collective knowledge, understanding of water resource uses, infrastructure, management and allocation today. WEAP now offers us the opportunity to concretely experience the effects of climate change on the Durance river and to test adaptation levers. In order to collectively make the best decisions and guide public policies.
Pascal Dumoulin Syndicat Mixte d'Aménagement de la Vallée de la Durance (SMAVD) FranceWEAP has become a key tool to develop my research and I also include it in my teaching as a very user friendly tool to understand the dependencies between water resources systems components.
Dr. Andrea Momblanch Benavent Cranfield Water Science Institute, Faculty of Engineering and Applied Sciences United KingdomI've seen WEAP be most effective in a recent effort by Valley Water to evaluate proposed reservoir operating rules in three main watersheds in our area that are intended to mainly benefit anadromous fish in in our local streams while balancing our water supply needs.
Eric Olson Santa Clara Valley Water District USAWEAP has been immensely useful in meeting the mission of the California Water Plan. Having an integrated, physics-based, high-level model that can reliably calculate important change factors has allowed us to efficiently examine future conditions.
Paul Shipman California Department of Water Resources, Division of Planning USAHighlights
Discover the core features that make WEAP a powerful tool for water resources planning and decision support


